Recovered Tests
A test can have a Recovered status, meaning it initially failed but was automatically fixed during execution by Checksum’s auto-recovery. Recovered tests count as passing in the overall results but are flagged separately for visibility. In the test report:- Recovered tests show with a distinct Recovered status indicator
- The recovery reason (e.g., “selector not found — used smart selector”, “element not visible — retried with wait”) appears at the top of the test details
- You can see exactly what the CLI did to recover the test
Viewing Test Results
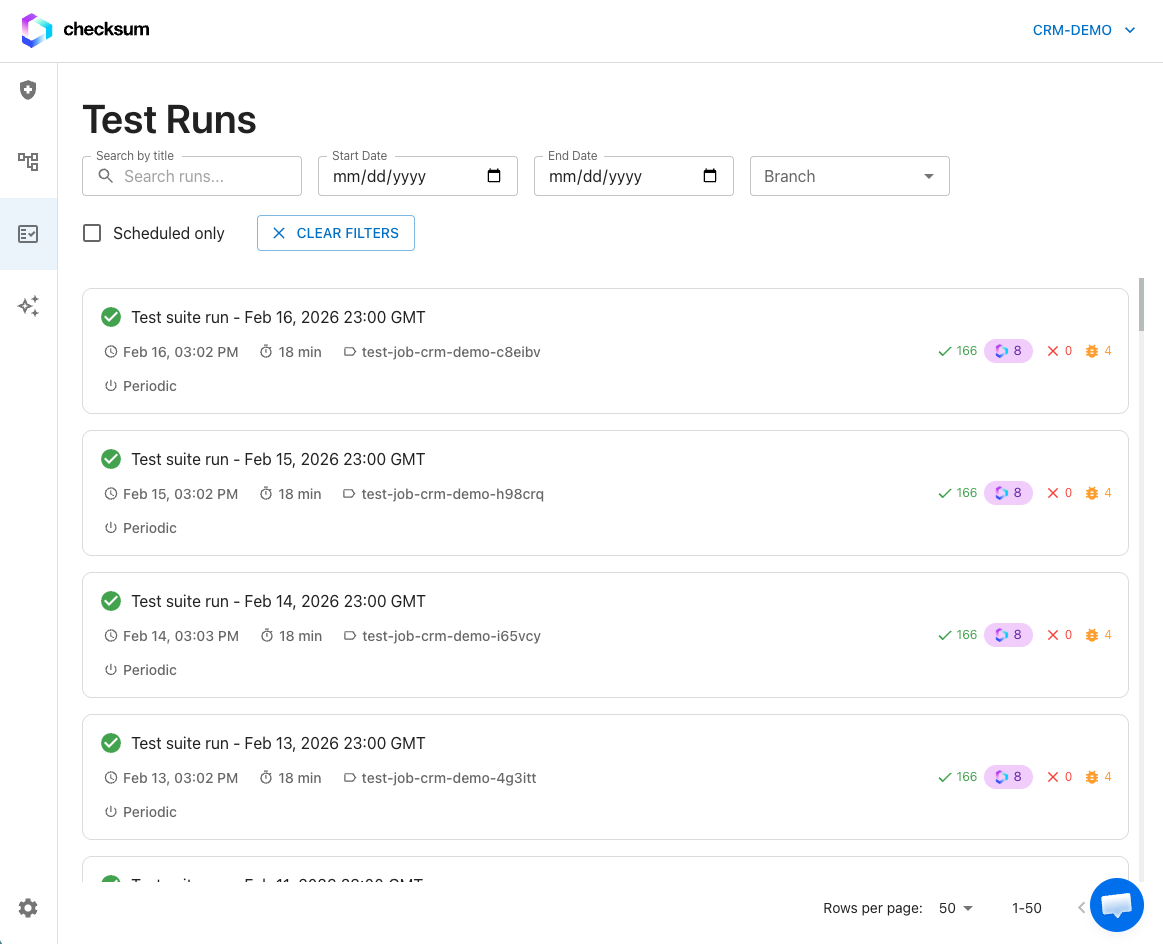
Navigate to Test Results in the sidebar to see all test runs.Filtering
Filter test runs by:- Environment — which testing environment was used
- Branch — which git branch the tests ran against
- Mode — normal or auto-heal
- Status — running, passed, or failed
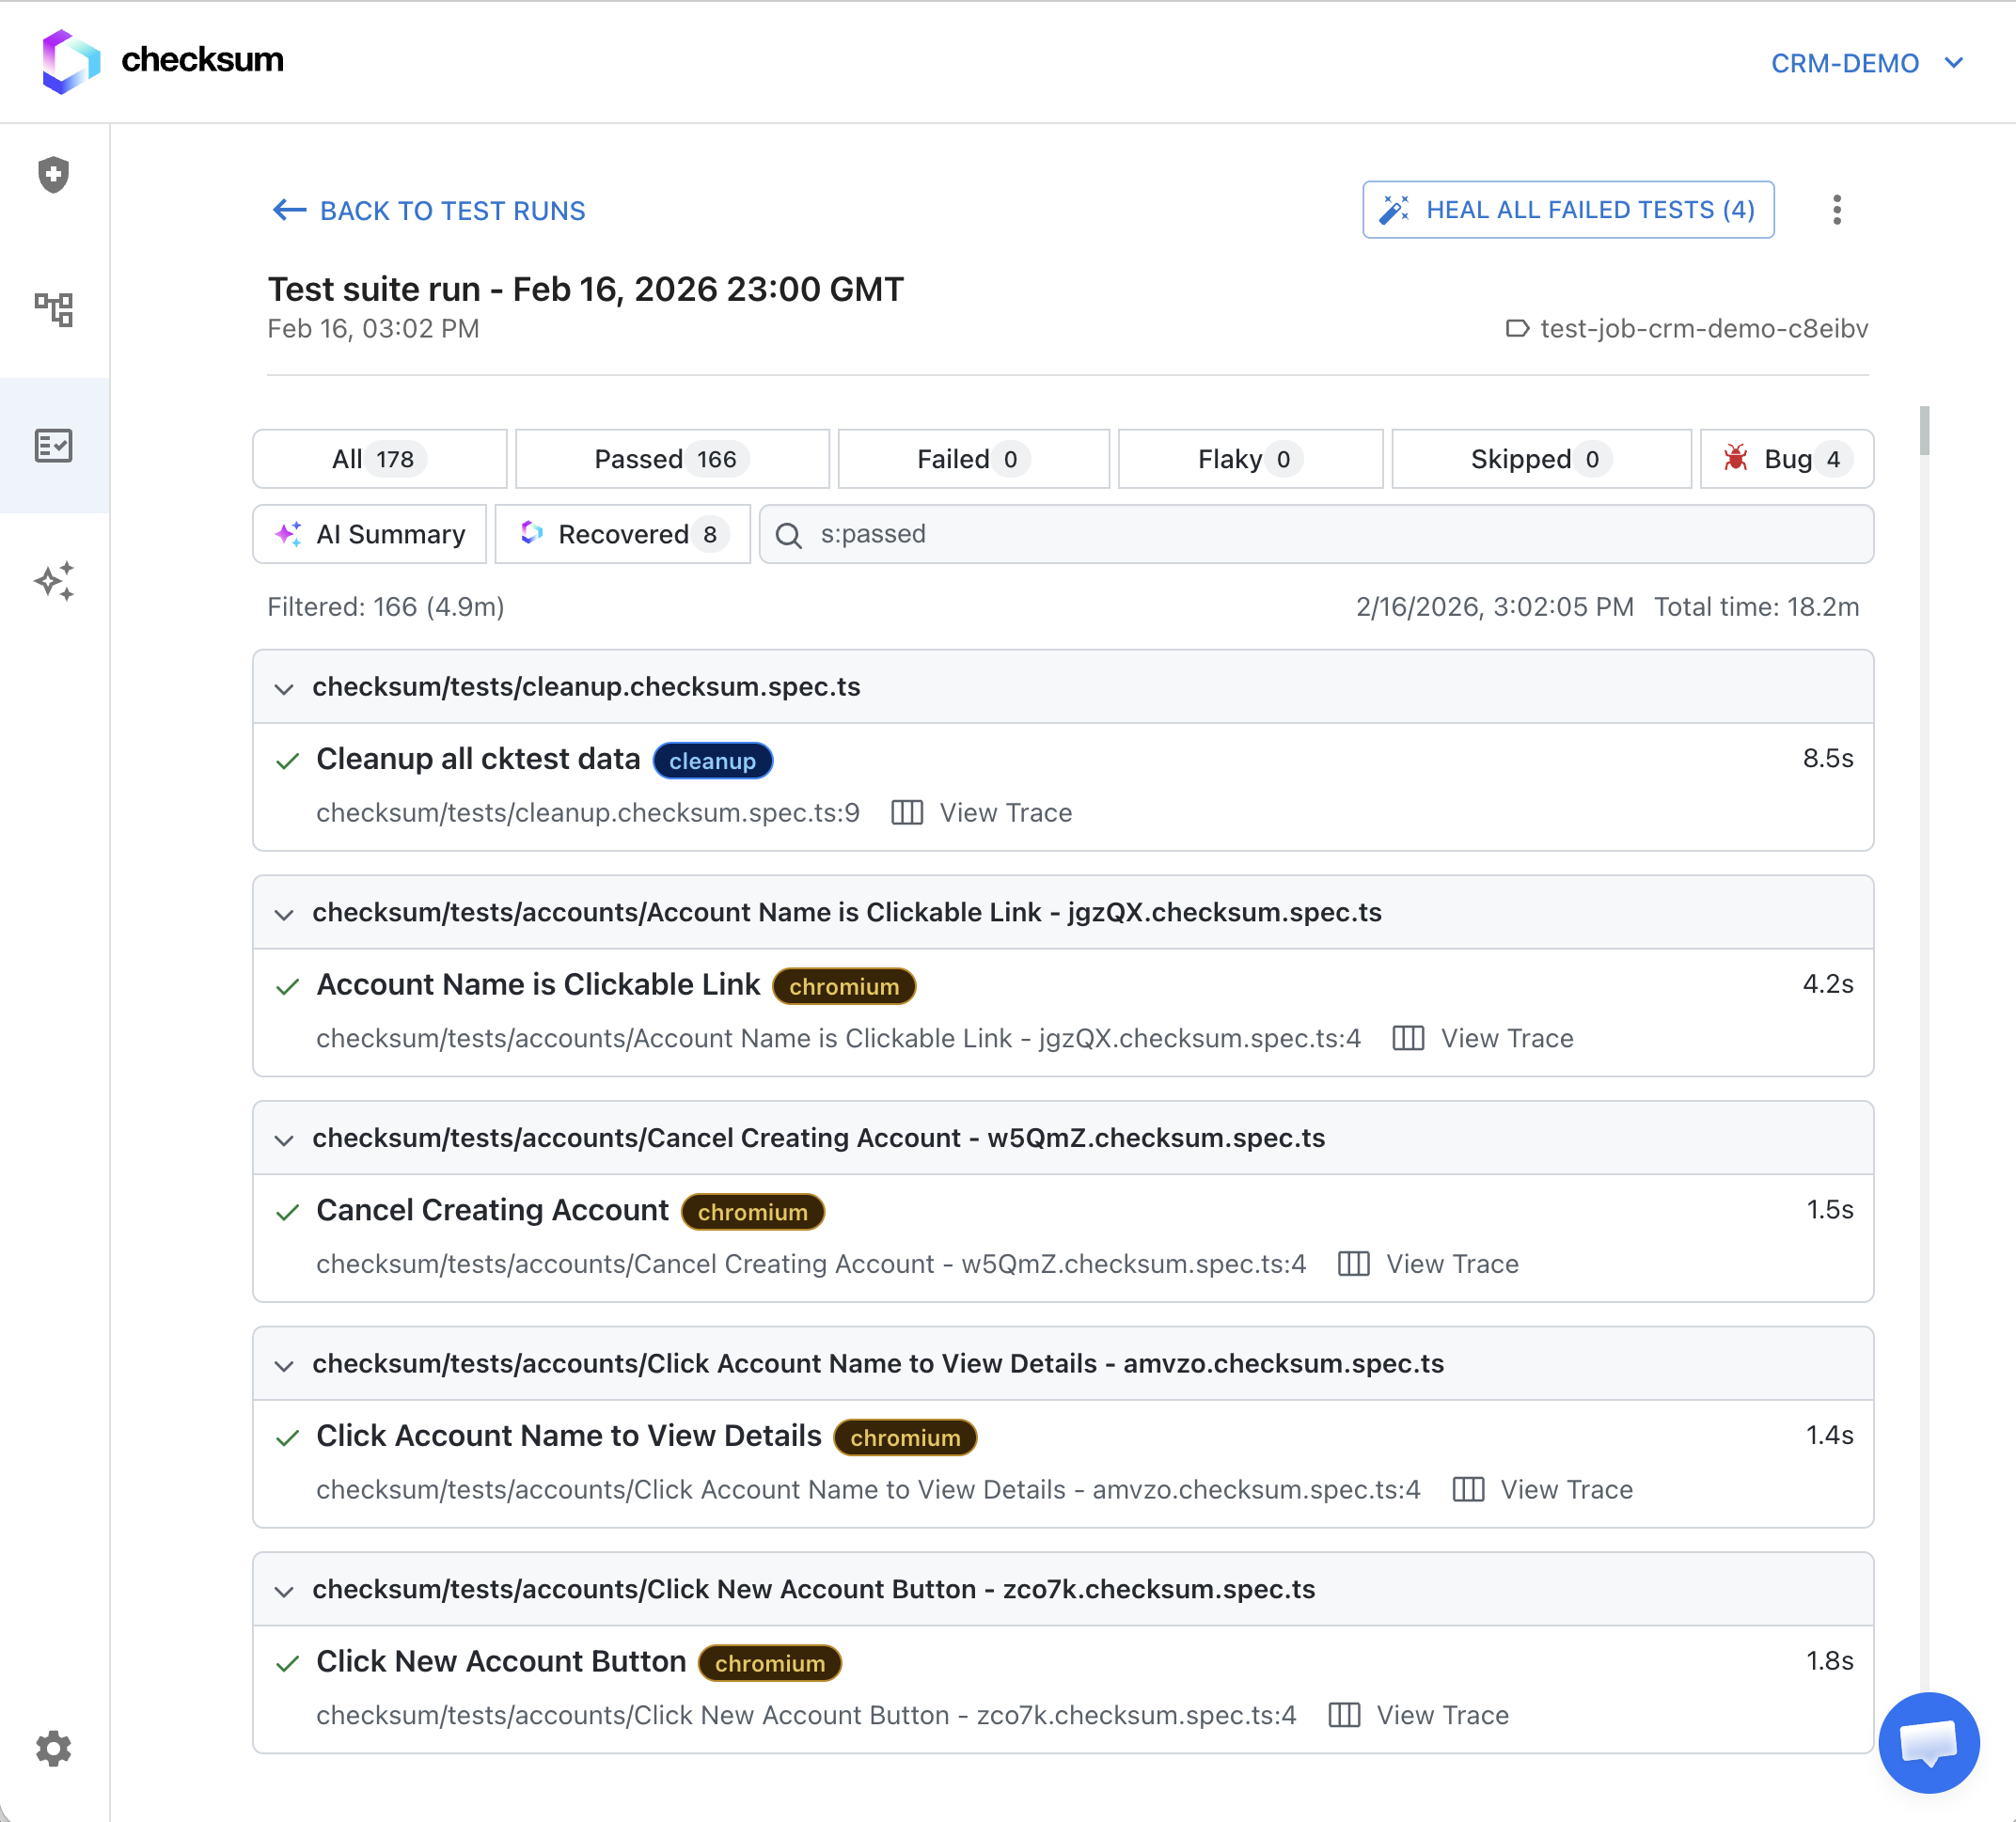
Test Run Details
Click on a test run to see the detailed report. Each test run shows:| Metric | Description |
|---|---|
| Passed | Number of tests that passed |
| Failed | Number of tests that failed |
| Healed | Number of tests that were auto-healed during execution |
| Duration | Total execution time |
| Branch | Git branch the tests ran on |
| Commit | The commit hash at the time of execution |
Report Artifacts
For each test, the CLI captures and uploads:- Videos — Screen recordings of the browser during test execution. Useful for understanding what the test actually did.
- Screenshots — Captured at key checkpoints and automatically on failure. Shows the exact state of the page when something went wrong.
- HAR Files — Network traffic recordings showing all HTTP requests and responses during the test.
- Playwright Traces — Detailed execution traces that can be opened in the trace viewer.
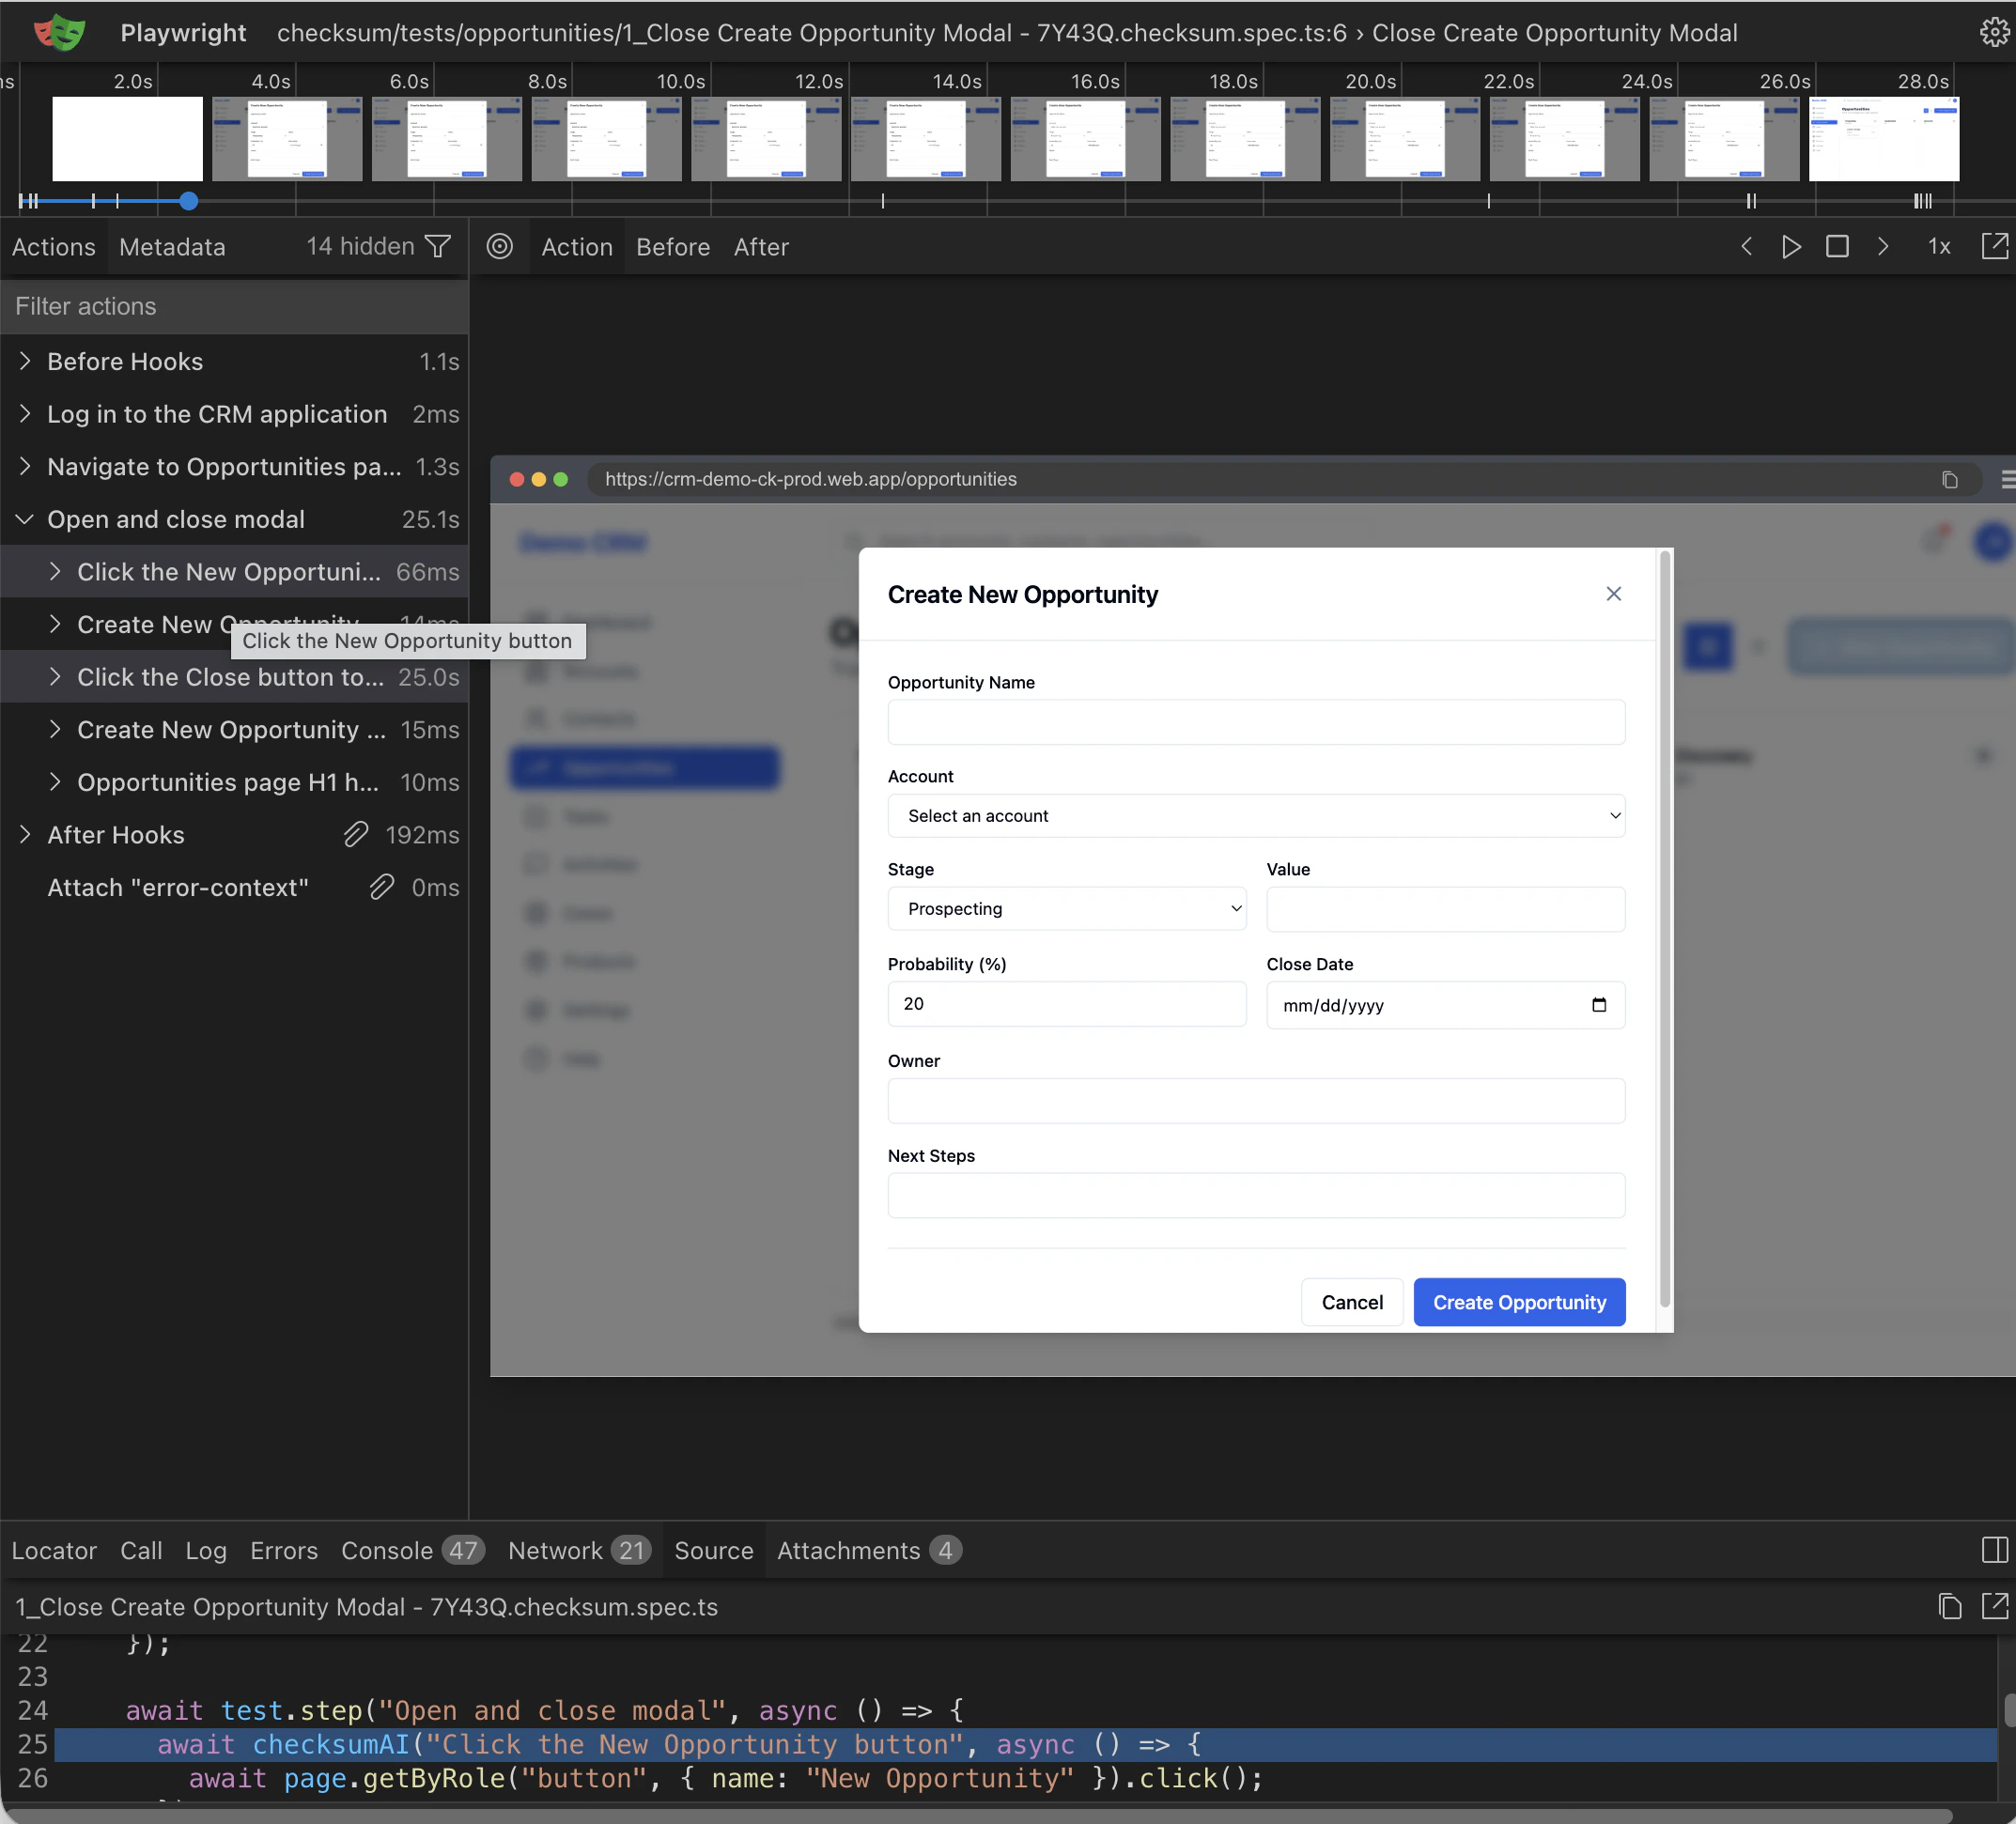
Trace Viewer
The Playwright trace viewer lets you step through a test execution frame by frame. It’s the most powerful debugging tool for understanding why a test failed. The trace viewer shows:- Timeline — Visual timeline of all actions the test performed
- Screenshots — Before and after each action
- DOM snapshot — The page’s DOM at each step
- Network — HTTP requests made during each action
- Console — Browser console logs
Linking to Commits and PRs
Test runs are automatically linked to:- The git commit that was checked out when tests ran
- The pull request (if applicable)